Fiserv Inc.

Baoro Research
Fiserv Inc.
[Summary]
This equity research report evaluates Fiserv as a durable financial infrastructure company whose recurring revenue, embedded customer relationships, and exposure to expanding payment and transaction markets are offset by weakening monetization and elevated financial leverage. Our segment analysis finds that Merchant Solutions continues to grow payment volume faster than the broader market, while Financial Solutions benefits from rising global transaction activity; however, declining take rate and revenue yield limit the conversion of that growth into revenue. We estimate that Fiserv’s current 54% debt-to-capital ratio exceeds its approximately 40% optimal level, making disciplined deleveraging an important consideration. Even under conservative operating assumptions, our valuation ranges from $68.50 to $99.00 per share, with a base-case estimate of $83.75, suggesting that the current market price reflects more deterioration than the company’s underlying performance warrants and offers an attractive risk-reward opportunity for investors willing to accept near-term execution risk.
A. Equity Research Outline
We will begin by describing Fiserv’s business and its operating segments. We will then identify the key headwinds that have contributed to the company’s rapid and significant decline in share price, assess the underlying fundamental developments driving these risks, and use those findings to establish our expectations for the company’s future performance. These expectations will form the basis of our forecasts and ultimately our assessment of the potential upside, if any.
A1. Financial Leverage and Capital Structure
We will begin our analysis of the key risks by addressing the most significant balance sheet consideration: Fiserv’s level of financial leverage. To assess both the extent of its leverage and the risk associated with it, we will first examine the company’s debt-to-capital ratio and other relevant measures of financial leverage.
We will then estimate Fiserv’s optimal capital structure by evaluating its cost of equity and cost of debt across different debt-to-capital ratios. The objective is to identify the capital structure at which Fiserv’s weighted average cost of capital is minimized. We will then compare this estimated optimal structure with Fiserv’s current capital structure to assess whether the company has sufficient capacity to take on additional debt or whether further deleveraging would be appropriate.
A2. Operating Drivers and Segment Analysis
We will then turn to the key operating drivers of the business and the underlying dynamics that have contributed to the recent slowdown in growth. For analytical purposes, we will treat Fiserv as two distinct businesses: Merchant Solutions and Financial Solutions. This approach allows us to examine the fundamental drivers of each segment independently and determine where the current pressure on growth is originating.
A3. Merchant Solutions
For Merchant Solutions, we will begin by analyzing trends in gross payment volume (GPV), which represents the total dollar value of payments processed through Fiserv’s platform. We will examine GPV on a quarterly basis to identify changes in transaction volume and the pace at which Fiserv’s underlying payment activity is growing.
Because comprehensive estimates of total addressable payment volume are generally published less frequently than Fiserv reports its results and may not align with its quarterly reporting periods, we will construct our own estimates using quarterly disclosures from Visa, Mastercard, American Express, and other payment networks and processors. We will then compare Fiserv’s GPV with our estimate of total addressable payment volume to assess whether the company is expanding its share of the addressable market.
We will then examine Fiserv’s implied take rate, calculated as Merchant Solutions revenue generated for each dollar of GPV. Comparing changes in take rate with changes in GPV will allow us to distinguish between growth driven by higher payment volumes and growth driven by monetization. Together, these metrics should provide a clearer understanding of the fundamental dynamics underlying Merchant Solutions revenue growth and margin performance.
A4. Financial Solutions
We will then apply a similar framework to Financial Solutions, with an important distinction in the primary volume metric. Rather than using payment dollars as the principal measure of the addressable market, we will use total addressable transaction count.
This distinction is important because Financial Solutions provides substantial transaction-processing infrastructure to financial institutions. Its economics are therefore more closely linked to the number of transactions processed than to the dollar value of the underlying purchases.
We will estimate total addressable transaction count using quarterly disclosures from Visa and Mastercard and estimate the remaining market by accounting for their respective shares of total transaction activity. We will then compare Fiserv’s Financial Solutions revenue with our estimate of total addressable transaction count to derive a revenue yield per transaction.
Examining revenue yield alongside total addressable transaction growth will allow us to determine whether changes in Financial Solutions revenue are primarily driven by changes in underlying transaction activity, Fiserv’s share of that activity, or the amount of revenue generated per transaction.
A5. Management and Financial Solutions Growth
Given the importance of Fiserv’s recent management changes to the future direction of Financial Solutions, we will conclude the historical analysis by assessing the new leadership team and its approach to the segment’s current challenges.
Specifically, we will examine the initiatives being undertaken to address the operational and growth pressures within Financial Solutions and assess how the new leadership’s strategy is positioned to address the segment’s ongoing growth drag. This will help bridge our historical analysis with our forward-looking assumptions.
A6. Forecast and Valuation
Using the operating drivers and relationships identified throughout the analysis, we will formulate forecasts for Fiserv’s key financial metrics. These forecasts will incorporate our expectations for payment and transaction volumes, market share, revenue yield and take rates, margins, capital requirements, and other relevant operating factors.
We will then use these forecasts to estimate the intrinsic value of the business through a discounted cash flow analysis. The valuation will use free cash flow to equity and an appropriate cost of equity to discount the projected cash flows.
Finally, we will compare our estimated intrinsic value per share with Fiserv’s current share price. This will allow us to assess the degree to which the current market price differs from our estimate of intrinsic value and determine the degree of opportunity under our assumptions.
B. Business Description
Fiserv is a global financial technology company that provides the infrastructure businesses and financial institutions use to accept, process, move, and manage money. Its business is divided into two main areas: Merchant Solutions and Financial Solutions. Merchant Solutions primarily serves businesses, helping them accept payments and manage their day-to-day commerce activities. Its Small Business segment, led by Clover, provides point-of-sale systems, payment acceptance, business management software, employee and inventory tools, and other services to small and midsized businesses. Its Enterprise business provides payment acceptance and commerce technology to larger merchants with more complex payment needs across physical stores, e-commerce, and other channels. Its Processing business provides payment processing infrastructure to financial institutions and other partners that serve merchants.
Financial Solutions primarily serves banks, credit unions, and other financial institutions. Its Digital Payments business provides infrastructure for debit payments, electronic money movement, bill payment, and other payment services. Its Issuing business provides technology that financial institutions use to manage credit, debit, and prepaid card programs, including transaction processing and related services. Its Banking business provides core banking and digital banking technology used to manage deposits, loans, accounts, transactions, and other banking functions. As a result, Fiserv operates across much of the financial transaction ecosystem, from the merchant accepting a payment to the financial institution processing the customer's account and card. The economic model combines transaction-based revenue, which is influenced by payment volumes and activity, with recurring software, processing, and service revenue. Because Fiserv's technology is often deeply integrated into merchants' and financial institutions' operating systems, customer relationships can be relatively durable and switching can involve significant operational and technological costs. Overall, Fiserv is best viewed not simply as a payment processor, but as a broad financial infrastructure company whose products enable businesses to conduct commerce and financial institutions to operate their payment, card, and banking systems.
C. Segments
C1. Merchant Solutions: Small Business
Small Business primarily consists of Clover, Fiserv’s integrated commerce platform for small and midsized businesses. Clover provides point of sales hardware and software that allows merchants to accept credit, debt, and digital payments while also managing functions such as sales, inventory, employees, customers, and business reporting. Fiserv earns revenue from the payment activity processed through Clover as well as software, subscriptions, and other value-added services.
C2. Merchant Solutions: Enterprise
Enterprise provides payment acceptance and commerce technology to larger businesses and organizations. It enables merchants to process payments across physical stores, e-commerce, mobile, and other channels while providing capabilities such as payment processing, security, fraud management, and other commerce services. Unlike Small Business, which is centered around Clover and smaller merchants, Enterprise focuses on larger merchants with more complex and higher-volume payment requirements.
C3. Merchant Solutions: Processing
Processing provides payment processing infrastructure primarily to financial institutions, payment partners, and other organizations that serve merchants. Rather than always having a direct relationship with the merchants, Fiserv can operate behind the scenes, processing transactions and providing the technology needed for its partners to offer merchant payment services. Its economics are therefore driven largely by transaction volumes and the processing services provided to these partners.
C4. Financial Solutions: Digital Payments
Digital Payments provides technology that enables electronic movement of money, particularly for financial institutions. It services include debt transaction processing, debit networks, bill payment, account to account and person to person payments, and related payment infrastructure. The business benefits from the increasing volume of electronic payments and the recurring nature of the infrastructure required to process them.
C5. Financial Solutions: Issuing
Issuing provides technology to financial institutions that issue credit, debit, and prepaid cards. Fiserv handles much of the infrastructure required to operate these card programs, including transaction processing, account management, card production, and related services. In simple terms, if Merchant Solutions is primarily involved in merchant accepting the card, issuing is involved in the bank or institution that issued the card.
C6. Financial Solutions: Banking
Banking provides core banking and digital banking technology to banks and other financial institutions. Its systems support functions such as deposit and loan account processing, account management, digital banking, financial management, and related services. This is one of Fiserv’s most software and infrastructure-oriented business because its technology can become deeply integrated into a financial institution’s core operations, making the relationship relatively recurring and embedded.
D. Financial Leverage
No business, regardless of the strength of its model, is immune to financial leverage risk because debt magnifies both returns and losses on capital. As a rule of thumb, a debt-to-capital ratio of 50% or less is often considered manageable, while a higher ratio may signal greater insolvency risk and borrowing costs. However, leverage must be evaluated against an appropriate benchmark. Sustainable debt levels vary by industry, sector, geographic exposure, and a company’s remaining debt capacity, among other factors. We therefore use an optimal capital structure framework to estimate the risks and costs of financing a business with debt and equity across a range of debt-to-capital ratios. The optimal capital structure is the point at which the weighted average cost of capital (WACC) is minimized and thereby where the firm value is maximized.
D1. Cost of Equity
We begin our cost-of-equity estimate by identifying the industries in which the company operates in and selecting the corresponding unlevered betas. As our preliminary data source, we use Professor Damodaran’s annually updated industry beta estimates (see https://pages.stern.nyu.edu/~adamodar/). Because Merchant Solutions primarily engages in merchant acquiring, payment processing, and digital commerce, we classify it as “Business & Consumer Services,” which has an industry-wide unlevered beta of 0.81. We classify Financial Solutions, which focuses on bank processing, card issuing, digital payments, and account processing, as “Financial Services (Non-bank & Insurance),” which has an industry-wide unlevered beta of 0.33.
Because these beta estimates are unlevered, we must adjust them for Fiserv’s financial leverage using the company’s debt-to-equity ratio and effective tax rate, which we calculate next.
D2. Market Value of Equity
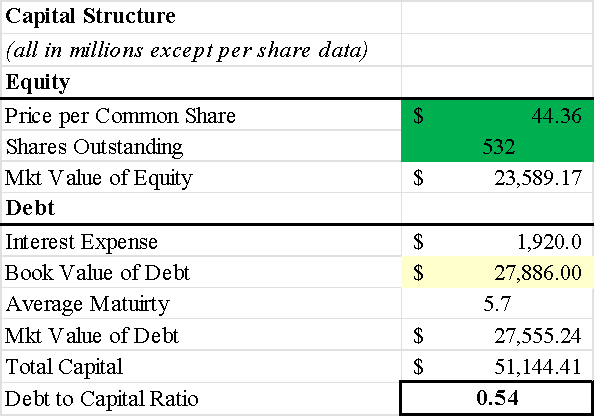
Estimating the market value of equity is straightforward: multiply the current share price by the number of shares outstanding. Based on a share price of $44.36 and 532 million shares outstanding, we estimate Fiserv’s equity market value at $23.59 billion.
D3. Market Value of Debt & Cost of Debt
To estimate the market value of debt, we treat the company’s outstanding obligations as a single bond and discount the expected cash flows at the current cost of debt. These cash flows include interest expense and annual lease payments, while the principal balance includes current and non-current debt, residual lease liabilities, and other contractual obligations reported on the balance sheet. We then estimate the obligations’ average remaining maturity and use the company’s current cost of debt as the discount rate.
Cost of Debt
Based on the current 10-year U.S. Treasury yield of 5.23% and the company’s interest coverage ratio of 2.3, the attached table indicates an appropriate company default spread of 1.11%. Because 15% of the company’s revenue is generated internationally and a detailed geographic breakdown is unavailable, we also apply a conservative international default spread of 0.8%. Together, these assumptions produce an estimated pre-tax cost of debt of 7.14%.

Effective Tax Rate
We use the 19% expected effective tax rate from the latest earnings presentation in our subsequent calculations.
D4. Capital Structure
The resulting market-value capital structure reflects a debt-to-capital ratio of 0.54 and a debt-to-equity ratio of 1.17.
D5. Finalizing Cost of Equity
Using the effective tax rate and the relative weights of debt and equity, we estimate Fiserv’s levered beta at 1.11, as shown below.

Using the Capital Asset Pricing Model (CAPM) and a long-term median equity risk premium of 5.36%, we estimate Fiserv’s cost of equity at 11.20%.

D6. Optimal Capital Structure
Using our current cost-of-equity and cost-of-debt estimates, which reflect Fiserv’s existing leverage, we can estimate both costs across a range of leverage levels, as shown in the table below.


With this, we can now calculate where the weighted average cost of capital (WACC) is minimized, which we estimate to be at debt to capital ratio of 40%.

Final words on leverage
Considering that the company’s current debt-to-capital ratio exceeds this level, we believe management should remain attentive to deleveraging and have a clear plan to reduce financial leverage. This direction was largely outlined during Fiserv’s 2026 Investor Day, where CFO Paul Todd stated that the company’s capital allocation priorities include returning excess cash to shareholders, primarily through share repurchases, while reducing its adjusted leverage ratio toward the low end of its 2.5x to 3.0x target range. Achieving this would further strengthen the company’s investment-grade balance sheet.
Although Fiserv has not yet reached this level of leverage, applying our forecasted revenue and a 30% operating margin, while holding the current market value of equity constant, implies a debt-to-capital ratio of approximately 0.45x. In our view, reaching this level would represent a meaningful step toward what we consider a more optimal capital structure. Importantly, this estimate is sensitive to changes in equity value. A meaningful appreciation in Fiserv’s share price would increase the market value of equity and, all else equal, reduce the debt-to-capital ratio, allowing the company to move closer to our estimated optimal capital structure without requiring an equivalent reduction in debt.
E. Merchant Solutions
Merchant Solutions represented approximately 52% of Fiserv’s total revenue over the trailing twelve months, generating approximately $10 billion during the latest fiscal year. The primary driver of the segment, and arguably its most relevant key performance indicator, is gross payment volume, or GPV.
GPV represents the dollar value of payments processed through Fiserv’s merchant ecosystem over a given period. It measures the scale of payment flow processed by the company rather than the revenue Fiserv ultimately earns from those transactions. In the latest quarter, Fiserv reported $367 billion GPV, representing 3.0% quarter-over-quarter growth and a 12.4% compound annual growth rate over the past year. We present these figures in the table below. Unless otherwise stated, all figures are presented in millions.

In our view, the absolute dollar value and growth rate of GPV provide an incomplete picture of Fiserv’s underlying revenue-generating capacity. To better assess the company’s operational potential, we believe GPV should be evaluated against the total addressable nominal payment volume, measured in dollar terms. This provides a broader view of the payment flows available to Fiserv and the extent to which the company is capturing those flows.
Because comprehensive data on total addressable payment volume is published infrequently, may contain reporting lags, and varies in historical coverage across sources, we estimated this figure internally using quarterly disclosures from Visa, Mastercard, and American Express. We reviewed their reported payment volumes across both U.S. and international markets to construct an estimate of total nominal payment volume on a quarterly basis.
Terminology also varies across the three companies. Visa refers to the measure as nominal card payments volume, while Mastercard reports purchase volume under its credit and debit programs. Although the terminology differs, these measures are intended to capture broadly similar payment activity and provide a useful basis for estimating the overall addressable payment volume.
We also made a number of judgment-based assumptions to estimate the portion of global payment volume not captured by Visa, Mastercard, and American Express. Specifically, we assume that the three networks collectively account for approximately 98% of worldwide transactions and use corresponding factor ratios to estimate the remaining volume. As a result, our figure should be viewed as an internal estimate rather than a reported industry statistic.
Our calculations are presented below. Unless otherwise stated, all figures are presented in millions
Visa

Mastercard

American Express

Rest of Market

Total Address Payment Volume (Visa + Mastercard + American Express + Rest of Market)

Implications of Analysis (Merchant Solutions)
Our data suggests that Fiserv operates against a significant macro tailwind, with substantial potential for further revenue generation as the underlying pool of payment volume continues to expand. The estimated addressable payment volume has grown by approximately 1.72% per quarter over the past two years, equivalent to roughly 7% on an annualized basis, driven primarily by growth in the nominal value of transactions, including international consumption.
More importantly, Fiserv’s quarterly GPV has grown at a faster rate than the underlying addressable payment volume. This suggests that the company has been increasing the value of payment flows processed through its merchant ecosystem at a rate above the growth of the overall market. Based on our estimates, Fiserv’s implied market share has increased by approximately 1.22% per quarter relative to the change in worldwide nominal consumption levels.
While this represents a favorable indication of the company’s underlying growth opportunity, the picture remains incomplete. GPV measures the volume of payment activity processed by Fiserv, but it does not indicate how much revenue the company generates from each dollar of that volume. We therefore need to examine Fiserv’s take rate, which measures the percentage of GPV that is converted into Merchant Solutions revenue. The table below presents the company’s key performance indicators alongside our calculated take rate, using quarterly GPV and Merchant Solutions revenue for each reporting period.

What the data suggests is that, despite GPV increasing at a faster rate than the underlying growth in worldwide nominal consumption, Fiserv is generating less revenue from each dollar of payment volume processed. The company’s take rate has declined consistently over time, indicating that growth in payment volume has not translated proportionally into Merchant Solutions revenue.
We view this primarily as evidence of increasing price-based competition. Smaller firms have become increasingly technologically capable, intensifying competition across the payments ecosystem and potentially limiting Fiserv’s pricing power. This represents our primary concern regarding the Merchant Solutions business. What currently mitigates this concern, however, is the positive differential between the rate at which GPV is growing and the rate at which the take rate is declining.
Specifically, GPV has grown at a compounded quarterly rate of approximately 2.97%, compared with a compounded quarterly decline of approximately 1.45% in the take rate. This positive spread currently provides a natural source of underlying growth for Merchant Solutions. Even under a more conservative scenario in which Fiserv’s GPV grows only in line with the total addressable nominal payment volume, the current decline in take rate remains within what we consider a manageable range, leaving a positive spread of approximately 30 basis points per quarter.
This relationship is particularly important to monitor because the economics become unfavorable once the rate of take-rate compression exceeds the rate of GPV growth. At that point, assuming no other offsetting factors, Merchant Solutions would no longer be able to generate positive revenue growth from payment volume alone. We therefore see two primary avenues through which Fiserv could reverse the current trend in take rate, both of which have been partially evident in recent developments.
The first, and in our view the most organic, is to expand the value of the products and services offered to merchants. This goes beyond simply adding merchants to Fiserv’s software and hardware ecosystem. The objective would be to develop products and services that better address the specific needs of individual merchants and provide additional value-added functionality alongside the company’s core payment offerings. Fraud protection is one example, as these services can generate incremental revenue without requiring GPV to increase proportionally. Fiserv has actively pursued this strategy, although a sustained improvement in take-rate growth has yet to become observable in the data.
The second avenue is to increase the mix of small businesses relative to large enterprises. In our view, this ultimately comes down to contractual negotiating power. Large enterprise customers generally possess greater bargaining power than smaller businesses because of their transaction scale and purchasing leverage, which can result in greater pricing pressure on Fiserv. Small businesses, by contrast, are more likely to value an integrated offering that combines payments, software, hardware, and value-added services, potentially allowing Fiserv to achieve better economics over time. Fiserv has increasingly pursued this strategy through Clover and its broader focus on small and mid-sized businesses. Importantly, greater pricing power should not come from unnecessarily compromising customer satisfaction, but rather from providing sufficient incremental value to justify the economics of the service.
A third avenue is simply to accelerate GPV growth. One potential way to achieve this would be to increase Fiserv’s exposure to international markets, where nominal payment volumes have historically grown faster than in the United States. However, pursuing growth through international expansion comes with additional risks and costs. Sustaining market share gains becomes more difficult as Fiserv encounters different regulatory frameworks, competitive environments, consumer behaviors, and business conditions. Accordingly, while international expansion could provide an additional source of growth, we would not view it as a risk-free solution to offset continued take-rate compression.
These strategies are easier said than done, particularly in an environment where consumer uncertainty remains elevated and U.S. consumer confidence has reached historically depressed levels. Nevertheless, the current positive differential between GPV growth and take-rate compression provides Fiserv with a favorable underlying tailwind. For us, the key question is therefore not simply whether GPV continues to grow, but whether management can stabilize the take rate and ultimately return it to positive growth. Future changes in Merchant Solutions’ take rate will be an important indicator of whether these initiatives are translating into improved underlying economics.
F. Financial Solutions
As of the latest fiscal year, Fiserv’s Financial Solutions generated revenue broadly comparable in absolute dollar terms with Merchant Solutions, generating approximately $9.7 billion. However, the segment has experienced considerably slower growth, increasing by approximately 30 basis points per quarter, equivalent to roughly 1.2% on an annualized basis over the past two years. Just as GPV and total addressable payment volume provide the appropriate framework for evaluating Merchant Solutions, we believe the key underlying volume indicator for Financial Solutions is the total number of transactions conducted worldwide.
For Financial Solutions, we believe total worldwide transaction count is a more appropriate measure of the underlying addressable market than nominal transaction dollar volume because the segment’s revenue generation is more closely tied to the number of transactions processed and the services associated with those transactions than to the dollar value of each individual transaction. The segment includes businesses such as issuing, digital payments, and banking services, where a higher transaction value does not necessarily translate into proportionally higher revenue. Using transaction count therefore provides a cleaner measure of underlying activity and reduces the distortion caused by changes in average transaction size, inflation, and consumer spending patterns. Accordingly, when assessing Financial Solutions, we believe comparing Fiserv’s transaction growth with the growth of total worldwide transaction count provides a more meaningful indication of the company’s ability to capture share of the underlying transaction ecosystem.
Using the same filings from Visa and Mastercard, we collected reported transaction counts and purchase transaction volumes from both networks. We excluded American Express from the direct transaction-count calculation because its reported data is more directly applicable to the card-issuing component of Fiserv’s Financial Solutions and therefore does not provide as broad a representation of the addressable transaction ecosystem. We then made a judgment-based estimate of the remaining worldwide transaction volume not captured by Visa and Mastercard. Specifically, we assumed that Visa and Mastercard collectively process approximately 56% of worldwide transactions and used this assumption to estimate the remaining transaction count.
The resulting data set is presented below. Unless otherwise stated, all figures are presented in millions

What we see from the data is that the estimated worldwide transaction count reached approximately 228 billion transactions in the latest quarter based on the most recent available sources. This represents a quarter over quarter compound growth rate of approximately 2.62%, equivalent to an annualized growth rate of approximately 10.89%. This suggests that Fiserv’s Financial Solutions business is operating with a favorable underlying market tailwind, with the addressable pool of transactions, and therefore the potential revenue base, expanding over time.
However, transaction growth alone provides an incomplete picture of the underlying economics, particularly because it does not capture how much revenue Fiserv generates from each transaction processed. To better understand the full dynamics at play, we compare the total addressable transaction count with Financial Solutions quarterly revenue to derive an internal metric we refer to as “revenue yield.” This measure allows us to assess whether Fiserv is translating growth in the underlying transaction ecosystem into proportionate revenue growth and whether its ability to monetize each transaction is improving or deteriorating over time.

What the data suggests is a similar dynamic to what we observe in Merchant Solutions, but with a more concerning magnitude. Against a backdrop of the addressable transaction pool growing at a compounded quarterly rate of approximately 2.62%, Fiserv’s revenue yield has declined by approximately 2.26% over the same period. In other words, while the underlying number of transactions continues to expand, Fiserv is generating progressively less revenue from each transaction, resulting in limited conversion of the underlying market growth into reported Financial Solutions revenue.
The resulting spread between transaction growth and revenue yield remains positive at approximately 36 basis points per quarter, but the margin of safety is relatively narrow. If revenue yield declines at an accelerated pace and the spread ultimately turns negative, the underlying transaction growth would no longer be sufficient to offset the deterioration in monetization. Holding all other factors constant, this would theoretically imply that Financial Solutions would no longer generate positive revenue growth from transaction volume alone. We therefore view the trajectory of revenue yield as a critical indicator of whether Fiserv can continue to translate growth in the underlying transaction ecosystem into sustainable segment revenue growth.
New Executive
The strongest argument for Fiserv’s new CEO, Takis Georgakopoulos, is that his background is unusually well matched to the specific problems the company is facing. Before joining Fiserv, Georgakopoulos spent approximately 17 years at JPMorgan, where he ultimately served as Global Head of Payments for the Corporate & Investment Bank. In that role, he was responsible for technology, product, sales, and operations across the payments business. This is particularly relevant because the central issue we have identified in Fiserv is not simply a lack of payment volume growth, but the company’s declining ability to convert that volume into revenue. His experience therefore gives him direct exposure to the economics of payments, including pricing, customer relationships, product development, technology, and payment processing.
His experience within Fiserv is arguably even more important. Georgakopoulos joined Fiserv in 2024 and subsequently became COO of Technology and Merchant Solutions before taking responsibility for Merchant Solutions and Technology. He therefore had direct exposure to the company’s largest and most important operating segment before becoming CEO. This matters because Merchant Solutions is precisely where we are seeing the most visible deterioration in economics. GPV continues to grow, yet the take rate has been declining. Having previously been responsible for the business gives him a much closer understanding of what is driving that deterioration and where management may have the ability to intervene.
His background could also be particularly useful in addressing the declining take rate for Merchant Solutions as well. As we discussed, simply increasing prices is unlikely to be a sustainable solution because larger merchants have significant negotiating power and the payments industry remains highly competitive. A more durable solution would be to increase the value Fiserv provides around the payment itself through software, fraud protection, data, commerce tools, embedded financial services, and other value added products. Georgakopoulos’s experience across payments, technology, product, and operations is relevant to this strategy because improving monetization ultimately requires Fiserv to offer merchants more reasons to remain within its ecosystem and pay for additional services.
For our investment thesis, however, I would be careful not to assume that a strong background automatically means a successful turnaround. His background gives us a reason to believe that the current deterioration in Fiserv’s monetization may be at least partially fixable, but the financial statements need to confirm that. The key evidence would be a stabilization and eventual improvement in Merchant Solutions’ take rate, an improvement in Financial Solutions’ revenue yield, GPV growth continuing to exceed addressable payment growth, transaction growth exceeding the broader market, and ultimately a recovery in organic revenue growth and margins.
G. Forecasts
Below is how we derived our revenue forecasts, which will subsequently serve as the foundation for our valuation framework. For Merchant Solutions, we assume that total addressable payment volume will increase by 1.65% per quarter, while Fiserv’s GPV continues to grow at an accelerated rate of 2.85% per quarter, broadly in line with recent trends.
We also assume that Fiserv’s Merchant Solutions take rate will continue to decline by approximately 1.39% per quarter. Despite the continued compression in take rate, the differential between GPV growth and take rate deterioration results in quarterly Merchant Solutions revenue growth of approximately 1.42%, equivalent to approximately 5.8% on an annualized basis.
For Financial Solutions, we assume that total worldwide transaction counts will continue to increase by approximately 2.52% per quarter, consistent with historical trends. However, we expect Fiserv’s revenue yield to decline by approximately 2.17% per quarter. This results in estimated Financial Solutions revenue growth of approximately 0.29% per quarter, or approximately 1.16% on an annualized basis.
Considering the relative revenue contribution of each segment, we estimate total GAAP revenue growth of approximately 0.85% per quarter, equivalent to approximately 3.44% on an annualized basis. In our view, this represents a reasonable base case that reflects continued underlying growth in payment and transaction volumes while appropriately incorporating the ongoing pressure on Fiserv’s monetization metrics.

Valuation
Given management’s latest guidance for an adjusted operating margin in the low 30% range, together with the historical relationship between adjusted operating income and free cash flow to equity, we assume a free cash flow margin of 19.53%. This assumption is slightly above recent trough levels but remains meaningfully below the company’s historical normalized levels, reflecting our expectation that cash flow generation will remain under pressure in the near term.
For the terminal value, we use a terminal growth rate equivalent to the long term U.S. Treasury yield. We believe this provides a reasonable reference point for long term nominal growth, as the nominal risk free rate incorporates components that are also fundamental to nominal economic growth, including expected real interest rates and expected inflation, while also incorporating a term premium. Although the Treasury yield and nominal GDP growth are not directly equivalent, their shared relationship with long term real growth and inflation provides a reasonable basis for anchoring our terminal growth assumption.

Assuming continued deterioration in the Merchant Solutions take rate alongside further deterioration in Financial Solutions revenue yield, we arrive at a base case valuation of $83.75 per share, implying approximately 83% upside from current levels.
Under a more conservative scenario, we assume that growth in the total addressable market for both payment volume and transaction count declines by 50%. We further assume that Fiserv’s GPV no longer outpaces the underlying market, instead growing in line with the reduced rate of addressable market growth, while the Merchant Solutions take rate and Financial Solutions revenue yield continue to deteriorate at their respective rates. Under these assumptions, we arrive at a valuation of $68.50 per share, still representing approximately 50% upside from current levels.
The resulting valuation range suggests that the market may be pricing in a substantially more severe deterioration in Fiserv’s underlying economics than our downside case assumes. In our view, this creates an attractive margin of safety, as the company does not require a meaningful recovery in its current operating trends to generate substantial upside from current levels. Given the contractual and recurring nature of much of Fiserv’s revenue, we believe the business can continue to generate meaningful cash flow even under relatively conservative growth assumptions. While growth may remain below historical levels, the combination of recurring revenue, substantial cash flow generation, and the current valuation presents what we believe is an attractive value investment opportunity.

Under a recovery scenario in which Merchant Solutions’ take rate returns to positive growth and Financial Solutions’ revenue yield stabilizes and begins to improve, supported by management initiatives and a recovery in broader consumer confidence, we arrive at a fair value estimate of approximately $99 per share. This scenario reflects the potential for Fiserv to not only benefit from continued growth in the underlying payment and transaction markets, but also to improve the rate at which that underlying activity is converted into revenue.

It is important to note that we maintain the same free cash flow to equity margin across all of the scenarios outlined above. Given that our assumed margin remains meaningfully below historical normalized levels, we believe this provides an additional layer of conservatism within our valuation framework. This allows us to assess the potential upside primarily through changes in operating performance rather than relying on an expansion in cash flow conversion. As a result, we believe our valuation incorporates a greater margin of safety and provides additional room for error in our assumptions.
It is also important to note that current management guidance effectively reflects a no growth scenario, which in our view is highly conservative given the favorable macro tailwind underlying the company’s payment and transaction markets, despite the deterioration in its revenue generating capacity. With market expectations now seemingly well anchored around this subdued outlook, we believe the combination of apparent undervaluation and conservative management guidance creates an asymmetric setup. Even modest improvements in operating performance relative to these expectations could prompt a meaningful re-rating of Fiserv’s valuation multiple, potentially at a relatively rapid pace.
Concluding Remarks
Fiserv remains a durable financial infrastructure business supported by recurring revenue, embedded customer relationships, and continued growth in global payment and transaction activity. Our analysis nevertheless identifies a clear operating challenge: Merchant Solutions is generating less revenue from each dollar of payment volume, while Financial Solutions is earning less revenue per transaction. Although underlying volume growth continues to offset this monetization pressure, the narrowing spread makes stabilization in take rate and revenue yield central to the investment thesis.
Despite these concerns, our valuation indicates that the current share price reflects a more severe deterioration than our assumptions require. We estimate fair value at $83.75 per share in the base case and $68.50 under more conservative assumptions, while a recovery in monetization supports a value of approximately $99 per share. Because all three scenarios retain a free cash flow margin below historical normalized levels, the resulting range provides a meaningful margin of safety without depending on a full return to prior operating performance.
Accordingly, we view Fiserv as an attractive value opportunity for investors willing to accept near-term execution risk. Evidence supporting the thesis would include sustained GPV and transaction growth, stabilization or improvement in monetization, continued cash generation, and progress toward the estimated 40% optimal debt-to-capital ratio. Conversely, faster take-rate compression, further deterioration in Financial Solutions’ revenue yield, market-share losses, or delayed deleveraging would weaken our conclusions. However, the current share price appears to reflect substantially more risk than the company’s underlying performance suggests. On balance, Fiserv’s recurring business model, favorable market tailwinds, and valuation discount support a positive risk-reward assessment.


Comments