MARKET UPDATE [JULY 2025]
- Jul 3, 2025
- 4 min read
Updated: Mar 11

Summary:
Valuation Revision: S&P 500 valuation increased due to a $50 billion rise in stock buybacks and a mixed earnings outlook—2025 earnings lowered slightly, while 2026 earnings were revised upward.
Equity Risk Premium Sensitivity: Valuations were analyzed using a range of equity risk premium scenarios centered around the 5.36% long-term average, highlighting how shifts in risk premium assumptions impact the S&P 500’s fair value.
Complementary Valuation Methods: Price-to-Cash Flow ratios, incorporating dividends and buybacks, support our findings and suggest a median S&P 500 target of 4,101.50—up approximately 100 points since the last update, indicating moderate upside potential.
Introduction:
This brief update outlines key developments in our equity valuation framework, including: updates to the model inputs used to estimate the equity risk premium and valuation; an assessment of the current valuation of the S&P 500 index; recent trends in the implied equity risk premium (IERP), our preferred measure of the price of risk in equities; valuation scenarios across a range of equity risk premium assumptions; and our outlook for the potential target level of the S&P 500.
Changes in inputs
Since our last market update, the total market capitalization of the S&P 500 has increased by approximately $200 billion, rising from $50.275 trillion to $52.152 trillion as of the time of analysis.¹ The 2025 earnings forecast has been revised downward from 263.6 to 260, while the 2026 earnings forecast has been revised slightly upward from 299.5 to 300.²
At the same time, we observed a significant increase in total cash flow returned to equity investors, primarily through stock buybacks. Preliminary dividend payouts for Q1 2025 totaled $164.10 billion, a modest decline from the $167.56 billion recorded at the end of 2024.³ In contrast, stock repurchases surged by approximately $50 billion, with preliminary Q1 2025 buybacks reaching $293.45 billion, up from $243.24 billion at year-end 2024.³
These shifts in market capitalization, earnings expectations, and capital returns play a critical role in shaping our valuation framework and the measurement of implied equity risk premiums, which we discuss in the following sections.
Valuation
The increase in baseline cash flows to equity investors, driven primarily by higher stock repurchases, has led to an upward revision in our valuation model for the S&P 500 index. Using the long-term average equity risk premium of 5.36%, our model yields the following results:
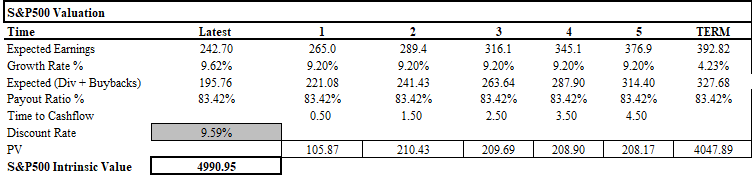
Valuation has been revised upward, driven primarily by a higher baseline level of cash flows to equity investors. Additionally, the compound annual growth rate (CAGR) of these cash flows has increased, as the downward revision to 2025 earnings was more than offset by an upward revision to 2026 earnings, resulting in a higher long-term growth estimate.
Valuation @ various IERP levels
A major factor influencing the valuation of the S&P 500 is the level of the equity risk premium (ERP) applied in our models. Higher ERP levels exert downward pressure on valuations, while lower ERP levels support higher valuations.
To capture a range of potential outcomes, we model valuations using equity risk premium scenarios based on ±1 and ±2 standard deviations from the long-term average. The current key implied equity risk premium (IERP) levels are shown below. Given our focus on long equity positions and associated downside risk, we place particular emphasis on the +1 and +2 standard deviation scenarios.

Please note that the valuation presented above reflects the base case at an IERP of 5.36%.
Valuation @ IERP = 6.14%

Valuation @ IERP = 6.91 %

Implied Equity Risk Premium Update
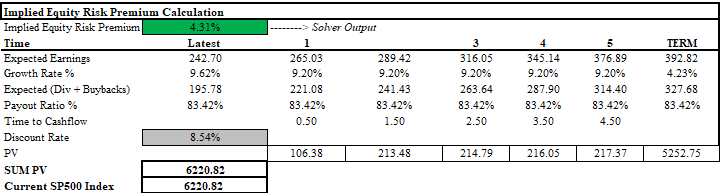
A natural follow-up to understanding index valuation across various levels of the implied equity risk premium (IERP) is determining where the current market stands in relation to those levels. To estimate this, we apply a method similar to calculating an internal rate of return in project finance by solving for the equity risk premium that equates the present value of expected future cash flows to the current index level.
With the S&P 500 currently observed at 6,220.82, the implied equity risk premium is calculated as follows:
A historical overview of IERP developments is also provided below:

Multiples Valuation
Since the valuations obtained through our discounted cash flow methods are sensitive to input assumptions, we complement them with valuation measures based on the Price-to-Cash Flow (P/CF) ratio. In this context, cash flows are defined as the trailing twelve-month aggregate of dividends and share repurchases. Below, we present equity index levels corresponding to various P/CF ratios.

Combination (Median projection)
Taking all factors into account, we present an overlay of these key valuation levels on the S&P 500 index. Included is the median projection of 4,101.50, which implies an upward revision of approximately 100 points to the index since our last market update.

Conclusion
Our updated analysis shows an upward revision in the S&P 500 valuation, driven by a $50 billion increase in stock repurchases and a revised earnings outlook, with 2025 earnings lowered from 263.6 to 260 and 2026 earnings raised from 299.5 to 300. This has pushed the long-term growth estimate higher.
Using equity risk premium scenarios around the 5.36% long-term average and a current index level of 6,220.82, we calculated the implied equity risk premium consistent with market pricing. To complement this, we applied a Price-to-Cash Flow ratio based on dividends and buybacks.
Our combined analysis suggests a median target for the S&P 500 at 4,101.50, representing an upward revision of about 100 points since our last update. Overall, the data points to moderate upside potential while risks remain under close watch.
[1] Market cap source
[2] Yardeni Research source
[3] S&P stock buyback source
![MARKET UPDATE [JUNE 2026]](https://static.wixstatic.com/media/5cfcd7_b33f3ac13aa24b1f8f2e16b606e3d24c~mv2.png/v1/fill/w_255,h_94,al_c,q_85,enc_avif,quality_auto/5cfcd7_b33f3ac13aa24b1f8f2e16b606e3d24c~mv2.png)
![MARKET UPDATE [MAY 2026]](https://static.wixstatic.com/media/5cfcd7_95bac270edc84e7a829382226a8ecbfb~mv2.png/v1/fill/w_980,h_560,al_c,q_90,usm_0.66_1.00_0.01,enc_avif,quality_auto/5cfcd7_95bac270edc84e7a829382226a8ecbfb~mv2.png)
![MARKET UPDATE [APRIL 2026]](https://static.wixstatic.com/media/5cfcd7_91ba323617f14526ab004fc4248a6574~mv2.png/v1/fill/w_980,h_551,al_c,q_90,usm_0.66_1.00_0.01,enc_avif,quality_auto/5cfcd7_91ba323617f14526ab004fc4248a6574~mv2.png)
Comments