CGI Inc.
- Mar 6
- 19 min read

<Summary>
CGI Inc presents an attractive buying opportunity at current price level, as our valuation analysis indicates meaningful undervaluation. While the valuation gap itself supports our Strong Buy recommendation, the investment thesis is also underpinned by the company’s durable competitive positioning within a services industry where competition is driven primarily by quality, reliability, and execution over price.
CGI benefits from structural advantages that support long-term stability and growth. The company maintains strong client loyalty, reflected in consistently high retention rates and long-standing relationships with government and institutional clients. Its contractual service model creates high switching costs, while regulatory and procurement requirements act as barriers to entry for potential competitors. Together, these factors contribute to a resilient competitive position and stable long-term demand.
Macro trends further strengthen the outlook. Government and institutional spending on technology and digital infrastructure remain elevated, with ongoing investments aimed at improving operational efficiency and modernizing systems. At the same time, organizations are increasingly prioritizing technology providers that can deliver measurable returns on investment (ROI), positioning CGI well given its focus on efficiency and performance-driven services.
We believe the recent share price weakness is largely driven by short-term uncertainty related to developments within government institutions, including periodic shutdown risks in the United States. However, these developments also highlight the continued need for governments to modernize and enhance their technological infrastructure; an area where CGI plays a critical role. As such, we view the recent decline primarily as a temporary dislocation rather than a deterioration in fundamentals.
A. Business
Established in 1976, CGI stands as a prominent IT and business consulting firm with around 94,000 consultants and professionals worldwide. The company offers comprehensive solutions that enable clients to maximize returns on their digital investments. Its services include business and strategic IT consulting, systems integration, managed IT and business process services, and intellectual property solutions. Business and strategic consulting covers topics such as responsible use of artificial intelligence, sustainable supply chains, environmental, social and governance strategies, mergers and acquisitions, and more. In systems integration, CGI assists clients in modernizing legacy systems and adopting innovative technologies for improved insights and competitiveness. CGI’s intellectual property solutions are adaptable business platforms delivered as a service, integrated within their offerings in areas like security, data privacy, cloud neutrality, and advanced AI, providing clients with immediate advantages.
B. Competition
As demand for ROI-driven digitization grows, CGI is well positioned as a preferred digital partner. Its competitors include local specialists, government-focused firms, and global consulting and IT providers, all offering similar services.
Dimensions of Competition
The dimensions of competition extend beyond mere price-based rivalry. The scope of competitive factors includes, but is not limited to, the following:
· Depth and breadth of industry and technology expertise
· Local presence and strength of client relationships
· Extensive and flexible global delivery network, including onshore, nearshore and offshore options
· Breadth of digital IP solutions
· Embedding AI to drive business outcomes across the client’s transformation journey
· Total cost of services and value delivered.
· Ability to deliver practical innovation for measurable results
· Consistency under real constraints such as time and budget.
Major Competitors
The company’s major competitors are:
· Global Payments Inc.
· Accenture PLC
· International Business Machines Corp
· Tata Consultancy Services Ltd.
Market Leadership (Moderate)
Relative to the competitors mentioned above, the company appears to be among the smaller firms in the competitive landscape, with CGI Inc.'s market capitalization at $15.6 CAD billion (or $11.4 USD billion) compared to the industry average of $98 USD billion. Margin analyses indicate that the company does not hold a market leadership position, as its gross, operating, and net margins are below the industry average. Nevertheless, the company's return on equity and debt capital is approximately at the median, suggesting it maintains certain aspects of competitive advantage.

While market capitalization and profit margins are indicative of a company's market leadership, it is also essential to evaluate additional metrics for firms of this nature, particularly by comparing their revenue backlogs. Backlog refers to secured contracts that have not yet been fulfilled or recognized as revenue, offering insight into revenue predictability and stability. This metric reflects client confidence in the firm and underscores its competitive advantages. Additionally, examining the company’s book-to-bill ratio, an indicator of new business acquisitions (bookings) relative to delivered revenue, provides further perspective on the firm's growth and operational efficiency.
CGI Inc’s latest quarterly report shows a backlog of $31.32 billion CAD ($22.9 billion USD) and a book-to-billing ratio of 109.5%, or 110.4% over the past twelve months. For comparison, Accenture reported a book-to-bill ratio of 110%, IBM reached 120%, and Tata Consultancy Services posted 1.6 (driven by a record $12.2 billion in total contract value). While CGI may not lead in market cap or profitability, its demand, as shown by comparable book-to-bill ratios to much larger competitors highlights its solid market presence.
Network Effect & Switching Cost (High)
Although the company does not benefit from the direct user-to-user network effects common in social media or marketplace platforms, it derives considerable advantage from high switching costs. The organization effectively establishes strong “lock-in” mechanisms, primarily through its service delivery model. Given that the projects managed by the firm frequently involve mission-critical infrastructure, cybersecurity, and essential business processes, replacing a provider deeply integrated within operational architecture is both complex and costly. Additionally, CGI’s local proximity model enables consultants to develop a thorough understanding of each client’s unique business challenges, legacy systems, and organizational culture. The potential loss of this institutional knowledge, coupled with the need to onboard a new vendor, further increases switching costs. Moreover, the contractual structure of the company’s revenue streams, often including provisions for early termination penalties, creates additional financial barriers for clients considering a transition to other vendors.
Customer Loyalty & Brand Strength (High)
Consistent with observed high switching costs, the company has maintained a client retention rate exceeding 95%, which is attributed to both substantial switching barriers and its established reputation as a reliable partner. Over the past decade, CGI's average client satisfaction score has remained above 90%.
Intellectual Property & Patents (Moderate)
Approximately 20 to 25% of CGI’s revenue is generated from proprietary, IP-led business solutions such as CGI Advantage, Momentum, and CGI All Payments. Although CGI maintains a smaller overall patent portfolio compared to large technology R&D companies, it strategically patents key innovations that support its platforms, particularly in the areas of financial and ERP systems, testing and validation, and industry-specific processes.
Cost Advantages (Low)
CGI Inc, does not compete as a “low cost provider” in the sense of being the cheapest option on the market. This is evidential when we refer back to the overall margin metric that we have observed for the company prior.
Regulatory Barriers (High)
The company’s long standing footprint in the public sector creates significant regulatory barriers for new entrants. Many of CGI’ government contracts require top tier security clearances for employees and facilities. Obtaining these takes years of operational history, audit compliance, and vetting. New, smaller competitors cannot simply bid on these projects without these pre-established credentials.
Growing complexity in the compliance landscape serves as a unique tailwind for firms as they serve regulated sectors like finance and healthcare which require adherence to rigid framework. CGI often helps clients navigate their own regulatory pressure. Furthermore, regulators are increasingly scrutinizing “vendor risk”. Governments and banks prefer to consolidate their IT spend with a few large, stable, and highly audited providers like CGI, rather than managing a vast array of small, high-risk vendors. The complexity of operating and catering towards clients across the world where they are subject to various international regulations and policies also give them a clear advantage through their extensive experience and long standing relationships that they have built through time and experience.
While regulatory expertise is a strength, CGI is simultaneously sensitive to sudden political shifts. As seen recently in the U.S federal landscape regarding political initiatives aimed at “efficiency” as well as government shutdowns, these political narrative can create volatility, contract delays and in worst cases contract termination.
Distribution Network (Moderate to High)
CGI Inc’s distribution network, referred to as its “client proximity” and “global delivery” model is a core component of its competitive advantage. Unlike competitors that rely heavily on a centralized off shore model or purely onshore consulting, CGI utilizes a balanced, hybrid architecture that prioritizes deep, local relationships supported by a scalable worldwide network.
Pricing Power (Moderate)
CGI's pricing power does not stem from being a "premium brand" that can simply raise prices at will. Instead, it comes from the structural nature of its client solutions. The company’s proprietary, IP-driven offerings create high switching costs, and its projects are often mission-critical and comprehensive. These factors add layers of value, which justify some degree of premium pricing.
Although CGI possesses notable structural strengths, its capacity to implement price increases is constrained by several factors within the IT consulting sector. These include the commoditization of fundamental services, limitations arising from public sector budgets, and ongoing talent and wage inflation. Standard IT infrastructure, basic application maintenance, and high-volume tasks are subject to significant price competition from global competitors that benefit from highly efficient, low-cost delivery models. Additionally, the rapid advancement of artificial intelligence presents a new challenge, as its ability to commoditize critical data and offer solutions at minimal direct cost to clients further intensifies competitive pressures. While AI integration remains essential for business solutions, CGI must address the challenge of sustaining competitiveness and demand in an environment where clients increasingly have access to AI at little cost. To mitigate this risk, it is necessary for CGI to leverage deep integration strategies utilizing historical expertise, industry relationships, and specialized knowledge of industry dynamics.
Additionally, because much of CGI’s revenue is generated through government contracts, their pricing flexibility is often limited by legislative budget cycles and public procurement rules. Clients are very sensitive to how prices appear and frequently require competitive bidding that emphasizes cost efficiency, further restricting CGI's ability to set prices.
Moreover, the professional services industry relies heavily on labor. If wage inflation among IT professionals rises faster than CGI can offset those costs through managed services or IP-led contracts, profit margins will shrink.
Consistent & Impactful Research and Development (High)
CGI does not function like a traditional R&D heavy firm that pours billions into long-term projects, instead, the company focuses on acquisition as growth strategy with a “Buy and Build” discipline. CGI’s acquisition track record is one of the most consistent in the IT services industry. Since going public in 1986, they have completed over 105 mergers.
C. Key Macro Dynamics
C1. Nondefense Capital Good s Ex Aircraft
The non-defense capital goods excluding aircraft index is a vital macroeconomic metric for analyzing CGI Inc. because it serves as a reliable proxy for corporate confidence and more specifically, the willingness of business to invest in long-term technology. Because this indicator strips out volatile government defense spending and massive, lumpy aircraft orders, it acts as a "core" measure of private-sector investment in equipment and infrastructure. For a firm like CGI, which thrives on helping clients integrate new hardware and software into their operational workflows, this data provides a clear signal regarding the future pipeline of digital transformation projects.
When non-defense capital goods trend upward, it reflects a period of corporate expansion where businesses are actively refreshing their technical infrastructure. This environment is highly favorable for CGI, as these capital investments rarely function in isolation; they almost always require external expertise to manage, integrate, and secure. Consequently, a rise in core capital goods orders is a leading indicator for CGI, typically translating into an increase in their "Bookings" and "Backlog"—the two most critical metrics for anticipating the company’s future revenue growth.
Conversely, when the spending declines, it signals that companies are moving into a defensive posture, prioritizing cash preservation over technological modernization. In such cycles, CGI may face headwinds as commercial clients delay or cancel discretionary projects. However, it is essential to contextualize this: because a significant portion of CGI’s revenue is derived from stable, long-term government contracts, the company possesses a level of structural insulation that pure-play commercial tech firms lack. While the "Nondefense Capital Goods" indicator is an excellent barometer for the health of CGI’s commercial business, the company’s diversified portfolio ensures that its performance is rarely tied to a single macroeconomic variable.
This hypothesis is supported by a long-term correlation of 0.71 between CGI Inc’s share price and non-defense capital goods.

C2. Government Spending and Policy
Government spending and policy are foundational pillars for CGI Inc. Unlike purely commercial tech firms, a significant portion of CGI’s business, roughly 37%, is tied to public sector contracts at the federal, state, and local levels. This exposure creates a unique relationship where government priorities dictate CGI’s revenue trajectory.
The positive of this government agency ties stems from the fact that governments are often hampered by “technical debt”, relying on aging, legacy systems that are costly to maintain and vulnerable to cyber threats. Policy mandates that prioritize “digital transformation,” cybersecurity, or citizen service improvements acts as a long-term tailwind for CGI. Because governments operate on multi-year budgets, these projects often provide a stable, predictable revenue stream that is less sensitive to short-term economic cycles than commercial client spending.
However, government ties have proven to be, particularly on a more recent note, to be a double-edged sword. Government spending is highly sensitive to political climate. As seen recently, when administrations launch initiatives focused on “efficiency” or “budget-slashing”, CGI can find itself in the cross hair. Political shifts like these can lead to procurement delays, contractual risks such as termination or modification to active contracts. The close tie downside risks have also been more complicated with recent government shutdowns leading to greater uncertainty with governmental related expansionary efforts and thereby greater uncertainty in consistency and predictability for business operations for CGI.
Despite the on-going political landscape being navigated, in our view, investors should view government uncertainty as an opportunity. New administrations, regardless of their political stripe, often arrive with a mandate for "reform," "efficiency," or "digitization." These campaign-led mandates act as a trigger for sweeping modernization programs. When a government changes leadership, the new administration frequently initiates reviews of current systems, leading to the decommissioning of outdated legacy platforms and the procurement of modern, scalable solutions. For CGI, this transition represents a significant opportunity to secure long-term contracts for the implementation and management of these new, modernized digital infrastructures.
Furthermore, governments provide services such as healthcare, taxation, justice, and defense that are fundamentally essential to society. Unlike commercial enterprises, which might cut "discretionary" projects during a downturn to save money, government services cannot be simply "switched off" or paused. Because CGI builds and maintains the core systems that enable these functions, their work is categorized as "mission critical." Consequently, political volatility does not threaten the core demand for their services; instead, it shifts the focus to how these critical systems can be made more resilient, secure, and efficient in the face of new policy priorities.
E. Financial Analysis
E1. The Checklist
We utilize a structured checklist framework for all A-Series trades, assigning scores according to established criteria. The following checklist includes concise explanations regarding each item and its relevance.
· Return on Equity (ROE)
ROE is calculated by dividing net income by shareholder’s equity. It measures how efficiently management generates profit using shareholder’s capital. High and sustainable ROE indicates strong profitability and potential competitive advantages. It helps assess whether the company creates value for equity holders.
· ROE Coefficient of Variation
Coefficient of variation (CV) of ROE measures the stability of a company’s returns over time relative to their average level. It is calculated as the standard deviation of Roe divided by the mean over a given period. While the absolute ROE level tells you how profitable a company is, the coefficient of variation tells you how consistent those returns are through time. A lower CV indicates that returns are stable and predictable, which is often characteristic of high quality businesses with durable competitive advantages. Conversely, a higher CV suggests that returns are volatile, which is common in cyclical, commodity-exposed, or highly leveraged businesses.
· Return on Equity vs Cost of Equity
Difference between ROE and Cost of Equity (Ke) measures whether a company is generating returns for shareholders that exceed the minimum required by investors to compensate for the risk of holding the stock. Comparing ROE to Ke provides a direct assessment of value creation: if ROE exceeds the cost of equity, the company is generating economic profit and creating shareholder value. If ROE falls below Ke, the company is effectively destroying value because it is earning less than investors require for the risk taken.
· Return on Invested Capital (ROIC)
While the ROE metric offers equity investors valuable insights into a company's profitability, the ROIC provides a broader perspective on management performance by evaluating how the firm utilizes both equity and debt capital to generate returns. ROIC is determined by dividing after-tax operating profit by investor capital (equity plus debt, excluding excess cash), thereby measuring returns generated for all capital providers. Like ROE, a consistently high ROIC reflects robust profitability and potential competitive advantages, enabling investors to assess whether the company is creating long-term value.
· ROIC Coefficient of Variation
The CV of ROIC measures the volatility of a company’s returns relative to its average ROIC over a period of time. It is calculated by dividing the standard deviation of ROIC by its mean, providing a normalized measure of how stable a company’s capital returns are. While the average ROIC indicates how efficiently a company generates profits from all invested capital, the CV shows how consistent those returns are from year to year. A low CV indicates stable, predictable returns, which often reflects a durable competitive advantage, strong pricing power, and effective capital allocation. Conversely, a high CV signals volatile returns, which is common in cyclical or capital-intensive industries and can make future cash flows less predictable.
· Return on Invested Capital vs Weighted Average Cost of Capital (WACC)
Return on Invested Capital (ROIC) versus Weighted Average Cost of Capital (WACC) measures a company’s ability to generate value from the capital it employs. ROIC represents the after-tax operating profit generated from all invested capital including equity and debt, while WACC reflects the blended cost of financing that capital or the minimum return investors require for the risk they take. Comparing ROIC to WACC indicates whether a company is creating or destroying economic value. When ROIC exceeds WACC, the company earns more than its cost of capital, signaling value creation. When ROIC falls below WACC, the company earns less than investors require, effectively destroying shareholder wealth
· Altman Z score
The Altman Z-score is a financial metric developed by Edward Altman in 1968 to predict the likelihood of corporate bankruptcy. It combines multiple financial ratios such as working capital to total assets, retained earnings to total assets, earnings before interest and taxes to total assets, market value of equity to total liabilities and sales to total assets into a single score. This score categorizes companies in to safe, gray, or distressed zones, providing early warnings of potential financial failure. Over decades of research and application, the Altman Z score has proven highly predictive, with studies showing that it can accurately forecast bankruptcy risk one to two years in advance for publicly traded manufacturing firms and has been adapted to private companies and non-manufacturing sectors as well.
· Beneish M -score
The M-Score is a financial model developed by Messod Daniel Benesih, a professor at Indiana University, to detect the likelihood that a company has manipulated its earnings. It uses eight financial ratios derived from company’s financial statements such as day’s sales in receivables, gross margin, asset quality, sales growth, depreciation, and leverage to produce a single score. If the M-score is above a certain threshold (commonly -2.22), it suggests a higher probability that the company may be engaging in earnings manipulation; if its below the threshold, manipulation is considered less likely. The model became widely known after it successfully flagged companies like Enron before their accounting scandals became public.
· Trends in Free Cash Flow
Unlike net income, which can be influenced by accounting maneuvers or non-cash charges, free cash flow measures the actual liquidity generated by the company’s core business model. By analyzing the cash flow trends over time, an investor can determine if a company is becoming more efficient at converting sales into cash or if its struggling with ballooning operational costs or capital requirements. A consistent, upward trend in free cash flow is a strong indicator of financial self-sufficiency, suggesting that a company can fund its own growth, pay dividends, or reduce debt without needing to tap the capital markets.
· Trends in Net Debt Issuance
Net debt issuance trends provide critical insight into a management team’s capital allocation strategy and their view on the company’s long-term leverage. Persistent, increasing net debt issuance can signal that a company is struggling to generate sufficient internal cash to support its current scale or is aggressively using leverage to mask operational weaknesses. Tracking whether debt is used for productive asset expansion or merely to fill cash flow gaps provide a map of the firm’s financial stability and risk appetite.
· Free Cash Flow vs Net Debt issuance
Comparing free cash flow directly against net debt issuance reveals the company’s ultimate financial sustainability. If a company’s free cash flow is high and increasing while its net debt issuance is stable or decreasing, it is operating from a position of strength. Conversely, if a company has a wide end growing gap where the cash required to fund operations and growth far outstrips the cash generated by the business forcing a reliance on constant debt issuance, it suggests that the business model itself may not be economically viable in the long run. Monitoring this dynamic is often the best way to catch the early warning signs of a liquidity crisis before it is reflected in the stock price.
· Valuation
At Baoro Research, we operate on the fundamental premise that a company’s intrinsic value is the present value of its future cash flows. To capture a holistic view of the company’s worth, we evaluate performance through three distinct, yet interconnected, lenses.
1. Free Cash Flow to Equity (FCFE): The residual cash available to shareholders after all expenses, reinvestment, and debt obligations are met.
2. Dividends: A measure of the tangible cash returned to owners, reflecting the company’s maturity and commitment to capital return.
3. Total Shareholder Yield: The aggregation of dividends and net share repurchases, providing a comprehensive view of how management chooses to deploy excess capital.
Our investment criteria are two-fold. First, the stock must trades at a meaningful discount to the intrinsic value from our valuation models. Second, and equally important, we seek alpha generation: a situation where the expected rate of return offers a significant premium over the company’s cost of equity.
· Technical Entry Point
While we firmly believe that fundamentals are the primary engine of long-term value creation, we recognize that short-term price movements are often subject to technical volatility and market sentiment. A Baoro Research, we bridge this gap by synthesizing fundamental analysis with a technical framework.
We employ a proprietary model designed to identify the formation of local market troughs, key technical indicators that signal a potential reversal in price momentum. By discerning these technical entry points, it allows us to initiate positions at a more attractive time while proactively minimizing potential drawdowns.
E2. Checklist Application
ROE, ROE CV & ROE vs Ke
The company demonstrates a long-term return on equity (ROE) of 18%, with recent figures at 17%, both surpassing our benchmark rate of 15%. With a long-term regression beta of 0.59, we utilize the Capital Asset Pricing Model (CAPM) to estimate a cost of equity at 8%. The positive differential between ROE and cost of equity indicates that the company is effectively generating economic profits from shareholder capital. Additionally, the coefficient variation in long-term ROE stands at 0.11, reflecting strong consistency and predictability in returns. This supports the expectation that intrinsic value will continue to appreciate, driven by consistently increasing economic profits.
ROIC, ROIC CV & ROIC vs WACC
It is important to evaluate the company’s capacity to generate economic profits consistently, utilizing both equity and debt capital, as its capital structure comprises these two elements. The performance remains steady, with a long-term return on invested capital (ROIC) of 13%, aligning with recent results. The interest coverage ratio surpasses 10, and the company's capital structure consists of 82% equity and 18% debt, leading to an estimated weighted average cost of capital of 7%. The coefficient of variation in ROIC is notably low at 0.08, indicating impressive consistency in profitability. This positive spread reinforces the outlook for continued appreciation of intrinsic value, supported by sustained growth in economic profits at the firm level.
Altman Z-Score

The company’s Altman Z-score remains significantly above the threshold of 2.99, indicating a low probability of financial distress in the foreseeable future. Consequently, this suggests a minimal risk of permanent capital loss for investors.
Beneish M-Score

A Beneish M-Score of -2.42, which does not exceed the threshold of -2.22, indicates a lower likelihood that the company is involved in accounting manipulation. This suggests that the financial statements used for valuation and analysis are both auditable and reliable. Furthermore, this reduces the probability of permanent capital loss for investors.
Free Cash Flow vs Net Debt Issuance

The company’s free cash flow remains consistently above its net debt issuance, though the recent shift from negative to positive net debt issuance in the annual report indicates a higher degree of financial leverage that warrants ongoing observation. Despite this, the company’s persistent positive spread demonstrates a robust self-funding capability. It is able to cover operating needs, capital expenditures, and interest obligations, while also generating surplus cash to reduce principal or support strategic acquisitions, thus providing flexibility to decrease leverage over time.
Valuation
Dividend Discount Model

Using the dividend discount model with a terminal growth rate set equal to the long-term U.S. Treasury bond yield, we estimate an intrinsic value of 19.60, which is significantly lower than the company’s current stock price. While this indicates that there is a very low margin of safety from this perspective, several points should be considered. First, the company recently paid dividends, and its sustainable growth rate, calculated by multiplying the ROE by its retention ratio, shows that it can grow much faster than the 4% Treasury yield. Additionally, it becomes clear that dividends are not the primary method the company uses to return capital to shareholders; share buybacks are the main mechanism.
Dividend + Share Buyback Valuation
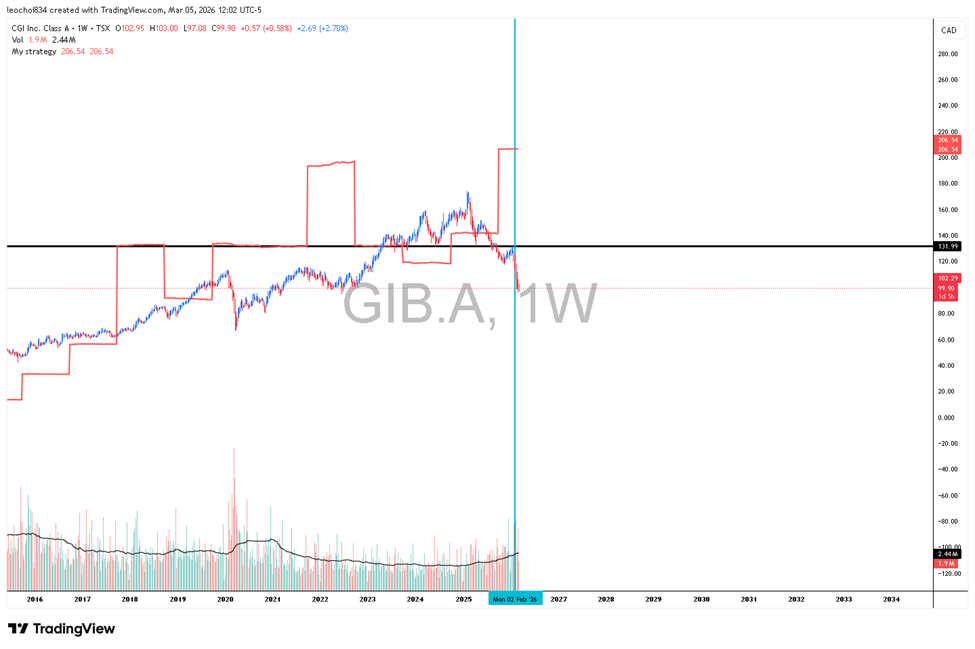
By incorporating the company’s aggregate capital return program to shareholders, the valuation model yields a more accurate representation of intrinsic value. When dividends and share buybacks are summed as total cash flow within the discounted cash flow framework—using the relevant cost of equity—the estimated intrinsic value is 206.54. This points to a significant undervaluation and implies a substantial margin of safety. It should be noted, however, that robust dividend or buyback activity must be supported by adequate free cash flow, which will be addressed in the subsequent analysis.
Free Cash Flow Valuation

By applying free cash flow to equity models with an appropriate cost of equity estimate, the intrinsic value is calculated at 398, indicating significant undervaluation relative to the current share price and presenting a substantial margin of safety. This assessment identifies a favorable entry point for investors who are comfortable with the associated risks and supports the reliability of intrinsic value calculations based on dividends and share buybacks. Additionally, the strength and sustainability of the company's capital structure, demonstrated by the positive spread between free cash flow and net debt issuance, reinforce the outlook for a long-term investment opportunity, even from a standalone valuation perspective.
Putting It All Together
In our view, CGI Inc. presents a compelling buying opportunity at its current price, supported by significant undervaluation based on our valuation analysis. While the apparent undervaluation is a key driver behind our strong buy recommendation, the investment case is further reinforced by the company’s durable structural advantages and its position within an industry characterized less by price competition and more by the quality, effectiveness, and efficiency of service delivery.
CGI benefits from strong structural customer loyalty, as evidenced by high client retention rates and longstanding relationships with government and institutional clients. The contractual nature of it business model creates substantial switching costs for customers, reinforcing client stickiness. In addition, regulatory requirements and procurement processes act as meaningful barriers to entry, limiting competitive pressure from new market participants. Together, these factors suggest that the company’s long-term business prospects remain on solid footing.
Favorable macroeconomic tailwinds also support the outlook. Government and institutional investments in technology and digital infrastructure continue to expand, as reflected by record levels of non-defense capital good investment. At the same time, market preferences are increasingly shifting toward technology firms that demonstrate clear return on investment (ROI) outcomes for clients. This trend aligns well with CGI’s service offerings, positioning the firm to benefit from sustained demand for its solutions.
We view the recent share price decline largely as a reaction to complex developments within government institutions such as periodic shutdown risks in the United States. However, these events also underscore the ongoing need for governments to improve operational efficiency and modernize technological infrastructure; areas where firms like CGI play a critical role. In our view, the market’s short-term reaction has created a temporary disconnect between price and long-term fundamentals, presenting an attractive entry point for investors.
That said, several factors warrant close monitoring. One notable trend is the shift in net debt issuance from negative to positive territory, indicating gradual increase in financial leverage and consequently, a modestly higher risk profile. Although CGI’s strong balance sheet currently provides a buffer, continued leverage expansion should be monitored carefully.
Additionally, heightened volatility in the geopolitical and governmental landscape could present downside risks, particularly the potential for contract delays or cancellations. While such cancellations typically involve termination fees that partially mitigate the financial impact, the risk remains material and should be factored into ongoing assessments.


Comments