FactSet Research Systems Inc.
- Feb 28
- 21 min read

FactSet Research Systems Inc.
Equity Research Report
Baoro Research
<One Pager>
<Summary>
FactSet remains a resilient pillar of the financial services ecosystem, currently trading at a valuation that fails to account for its structural advantages and sustained demand drivers. While the firm has been caught in the crossfire of market apprehension regarding generative AI, specifically fears that AI will commoditize financial data, we contend this narrative is largely noise. The true differentiator in the financial data landscape is not the speed of data ingestion, but the integrity and reliability of the information provided.
Unlike broad spectrum AI data feeders that struggle with hallucinations and indiscriminate scraping, FactSet’s value proposition is rooted in proprietary, curated datasets and a workflow integrated platform. These attributes, bolstered by high switching costs, regulatory barriers, and institutional stickiness, constitute a formidable competitive moat. When combined with a proven history of profitability and consistent excess return generation, FactSet is uniquely positioned to integrate AI as an augmentative tool rather than being disrupted by it.
Our outlook is further reinforced by two key macroeconomic tailwinds. First, labor market stickiness within the finance and insurance sectors ensures sustained demand for the essential workflow infrastructure FactSet provides, keeping seat counts high and stable. Second, the resurgence in global M&A activity, characterized by rising deal counts and transaction volumes since fiscal 2025, serves as a structural catalyst. This activity drives high intensity usage of FactSet’s analytical suite among dealmaker clients who require precise data to manage complex transactions.
The current divergence between these positive macroeconomic trends and FactSet’s share price suggests a meaningful market inefficiency. Our valuation models, which incorporate both organic cash flow growth and disciplined capital returns, indicate that the stock is currently mispriced relative to its intrinsic value. We view this disconnect as a compelling entry point for investors seeking exposure to a firm that is not only capturing the quality side of the AI narrative but is also leveraging a robust macroeconomic backdrop to drive long term earnings growth.
A. Business
FactSet is a global provider of financial digital platforms and enterprise solutions, delivering financial intelligence to investment professionals across the world. As of August 2025, the firm served approximately 9,000 clients comprising over 237,000 investment professionals, including institutional asset managers, bankers, wealth managers, asset owners, partners, hedge funds, corporate users, and private equity and venture capital professionals. The company’s primary revenue sources are subscriptions to multi-asset class data and solutions powered by a connected data and technology platform. Their offerings include workstations, portfolio analytics, and enterprise data solutions. Additionally, FactSet provides managed services that function as an extension of clients’ internal teams, supporting data management, performance analysis, risk assessment, and reporting workflows.
B. Segments
The company operates through three reportable segments: the Americas, EMEA, and Asia Pacific. Within each segment, the company offers data, products and analytical applications by firm type: Institutional Buyside, Dealmakers, Wealth, and Partnerships and CGS.
B1. Americas
The Americas segment primarily sells to clients in North, Central and South America. Revenues from the Americas represented 65% of total revenues during fiscal 2025.
B2. EMEA
The EMEA segment primarily sells to clients in Europe, the Middle East, and Africa via offices in Bulgaria, England, France, Germany, Italy, Latvia, Luxembourg, the Netherlands, Sweden and the United Arab Emirates. Revenues from EMEA represented 25% of total revenues during fiscal 2025.
B3. Asia Pacific
The Asia Pacific segment primarily sells to clients in Asia and Australasia via office locations in Australia, China, Hong Kong Special Administrative Region of China, India, Japan, the Philippines and Singapore. Revenues from Asia Pacific represented 10% of total revenues during fiscal 2025.
Firm Types
Institutional Buyside
Institutional Buyside focuses on multi-asset class solutions, including AI powered workflows and insights for global asset managers, asset owners and hedge fund professionals across the investment portfolio lifecycle. From workflows for research analysts, portfolio managers, and traders in the front office to performance analysts, risk managers, client service, and market professionals in middle office, the company offers comprehensive platform-based data and technology solutions through data feeds, APIs, programmatic access for clients and on-platform workstation offerings.
Deal Makers
Dealmakers focus on workflow solutions of investment bankers, sell-side research analysts, corporate users, investor relations officers, and private equity and venture capital professionals. The company offers solutions to clients including workstations, mobile solutions, data feeds, APIs, proprietary and third-party data, and productivity tools for Microsoft Office. Furhtermoe, the company delivers firm type tailored solutions for client relationship management and AI powered tools to bring automation to time consuming and manual aspects of clients’ daily workflows.
Wealth
Wealth focusses on comprehensive solutions to wealth management clients including web-based workstations, book of business dashboards for advisors, data feeds, APIs, proprietary and third part y data, and productivity tools for Microsoft Office. Wealth clients use advisory tools to provide support for their businesses, including home office, advisory, and client engagement work.
Partnerships and CGS
The firm also supports financial services ecosystem through data, analytics and technology platforms. This includes curated datasets and turnkey APIs which enable technologists and developers to power new AI-based workflows with programmatic access to FactSet’s connected content. CGS is the exclusive issuer of CUSIP and CINS identifiers globally. CGS also acts as the official number agency for International Securities Identification Number (“ISIN”) identifiers in the U.S and as a substitute ISIN agency for more than 30 other countries.
Revenues and Annual Subscription Value (ASV)
Majority of the revenues are derived from client access to multi-asset solutions powered by the platform of connected data and technology that is available over the contractual term. The company had 8,996 clients and 237,324 professionals using FactSet based on its latest 10-K. The client count includes clients with ASV of $10,000 and above and user count does not reflect users associated with fiscal 2025 acquisitions. Latest annual report suggests that the annual ASV retention was greater than 95%, and when expressed as a percentage of clients, annual retention was 91%. Buyside clients accounted for approximately 82% of Organic ASV while approximately 18% of organic ASV was attributable to sell side clients.
C. Competition
The company operates in a highly competitive industry. The current competitive market is comprised of both large, well-capitalized companies and smaller, niche firms including market data suppliers, news and information providers, technology firms, and many third-party content providers that supply financial information. The company’s largest competitors are:
· Bloomberg L.P
· S&P’s Market Intelligence Division
· London Stock Exchange Group (LSEG) Data & Analytics Division (formerly Refinitiv)
Market Leadership (Low)
While FactSet is a prominent multi-billion-dollar institution, its overall scale remains smaller compared to the leading firms in the financial infrastructure sector. FactSet's current market capitalization stands at approximately $7-8 billion, whereas direct competitors such as S&P Global and LSEG (Refinitiv) hold market capitalizations exceeding $125 billion and $45 billion, respectively.
Network Effect & Switching Cost (High)
The firm's integration into client workspaces through API connectivity, macros, and proprietary research databases ensures long-term customer retention. Transitioning to a competing platform entails significant operational risks and potential productivity losses, which effectively insulates FactSet from price-based competition. Additionally, the CSG segment relevant to CUSIP Global Services provides the company with a distinct competitive advantage. By functioning as a central resource for these identifiers, FactSet benefits from enhanced network effects.
Customer Loyalty & Brand Strength (High)
FactSet has cultivated an exceptionally high level of customer loyalty, largely by transforming its platform from a simple data provider into a indispensable institutional utility. FactSet’s retention metrics are some of the strongest in the financial information sector with annual ASV retention rate above 95%, which has been consistent for more than a decade.
Intellectual Property & Patents (Moderate)
FactSet holds a modest but strategic patent portfolio (around 50-60 patents globally). Most importantly, by being a sole CGS operator, FactSet controls the stewardship of this intellectual property.
Cost Advantages (Moderate)
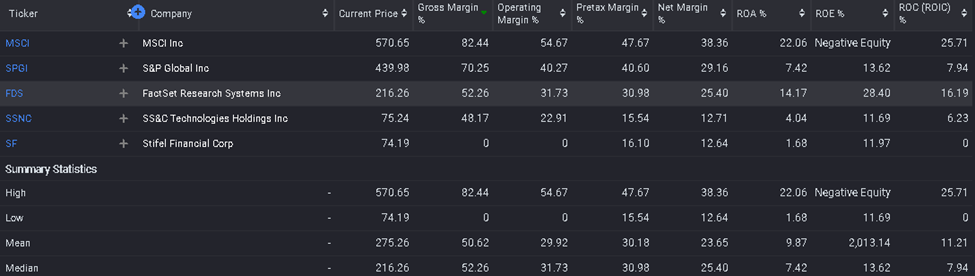
Financial firms incur substantial costs in cleaning, reconciling, and standardizing data from fragmented global sources. While FactSet maintains a strong absolute profitability, its margin reside in the median range relative to its closest peers.
Regulatory Barriers (High)
In the financial data industry, regulatory barriers acta as a double-edged sword; they are compliance burden that increases operating costs, but they also function as a competitive moat that prevents new smaller players from entering the market. FactSet doesn’t just manage its own compliances; it helps its clients manage theirs. Regulations like MiFID II, Dodd-Frank, and EMIR have dramatically increased the volume of data that the financial firms must report, store, and analyze creating a favorable structural tailwind for the business.
To compete with FactSet, a new firm wouldn’t just need a database of financial information, they would need a global team of legal and compliance experts, hardened cybersecurity infrastructure, and the ability to pass regulatory horizontal reviews. This regulatory environment mandates that only firms with massive scale and capital can afford to be major market data providers, protecting incumbent leaders from being disrupted by smaller, more agile tech startups who lack the resources to handle the massive compliance overhead.
Distribution Network (Moderate to High)
FactSet’s distribution network constitutes a fundamental element of its competitive advantage. Unlike many competitors that concentrate primarily on terminal-based solutions, FactSet has transformed itself into a leader in omnichannel data delivery. Its product suite now functions as an integrated ecosystem, enabling clients to access data in formats best suited to their internal workflows. Central to FactSet’s distribution approach is a strong commitment to interoperability. Through initiatives such as Microsoft Office Integration, an open platform strategy, and robust developer portals, FactSet significantly extends the reach of its distribution network, further strengthening its market position.
Pricing Power (Strong)
FactSet’s capacity to maintain or raise prices is supported by several structural advantages previously discussed. The company's “utility” moat, CUSIP stewardship, and high client retention rate collectively demonstrate its pricing power and reinforce the perception that FactSet’s services are essential rather than optional. Despite these robust structural strengths, FactSet is currently facing notable challenges. The first arises from the shift of assets from active to passive investment strategies, prompting clients to implement cost reduction measures. As a result, clients are increasingly resistant to price increases and more diligent about optimizing their FactSet expenditures.
Furthermore, the second and most significant source of friction is the prevailing market narrative, often referred to as the "SaaSPocalypse," which raises concerns that generative artificial intelligence may ultimately commoditize the data provided by FactSet. Although FactSet is proactively addressing this challenge by launching AI-driven products, there remains uncertainty in the market about whether these tools will sustain the premium pricing associated with their established terminal business.
However, before we dismiss this just as a source of risk, critical lens is required to view the full picture and what the risk posits. In our view, the true divided in the modern financial data landscape isn’t between “AI” and “traditional” models, rather it is between unverified volume and auditable truth. The current market obsession with AI efficiency has fueled a rush to commoditize data via web scale scraping and automated crawling. While this approach offers unparalleled speed and costs savings, it fundamentally ignores the “garbage in, garbage out” risk inherent in financial decision making. When an institutional investor relies on data harvested from unstructured noise of the open web, they aren’t just ingesting information, rather they are ingesting narrative bias, outdated metrics, and unverified rumors, all of which are prone to the “hallucinations” common in LLMs. In this context, raw efficiency creates a dangerous blind spot creating a narrative that high speed model built on fragile data is a liability, not an advantage.
Unlike prevailing perspectives, we posit that FactSet’s strategic shift toward internal AI development directly addresses potential vulnerabilities. By embedding generative AI within its established and reliable data infrastructure, FactSet is emphasizing operational effectiveness: delivering AI-driven insights based on audited, standardized, and contextualized information. The company is positioning its competitive advantage not in amassing data volume, but in serving as a trusted source of intelligence within the financial data sector, offering reliable and credible information amidst widespread synthesized content.
Consistent & Impactful Research and Development
FactSet has historically pursued a balanced growth strategy, combining organic expansion with targeted acquisitions designed to bolster its data assets and software capabilities. A defining moment in this strategy was the March 2022 acquisition of CUSIP Global Services (CGS) from S&P Global for $1.9 billion. As the exclusive provider of CUSIP and CINS identifiers, CGS is a foundational asset that significantly strengthens FactSet’s competitive moat by embedding its data into critical front-, middle-, and back-office functions across the global financial system.
Regarding profitability, FactSet’s margin outlook remains a central point of investor focus. At its September 2024 investor day, the company outlined a medium-term target for adjusted operating margins in the 37% to 38% range. Achieving this target appears increasingly complex, as elevated investment spending continues to exert pressure on profitability. FactSet’s initial fiscal 2026 outlook reflects these challenges, with adjusted operating margins projected at a midpoint of approximately 34.8%, a contraction from the 36.3% reported in fiscal 2025.
In the context of broader financial technology consolidation exemplified by major transactions such as the London Stock Exchange Group’s acquisition of Refinitiv and S&P Global’s merger with IHS Markit—FactSet is frequently identified as a potential acquisition target. The company’s stable recurring revenue model and strong long-term track record make it an attractive candidate for potential acquirers, particularly private equity firms seeking defensive assets in an evolving market.
D. Key Macro Dynamics
D1. Financial Sector Hiring / Layoffs
When large institutional firms are in a hiring phase, FactSet’s Annual Subscription Value (ASV) grows as new workstations are provisioned to support incoming personnel. Conversely, industry-wide cost-cutting or consolidation typically leads to seat erosion, as fewer active users result in fewer active licenses. To track this primary macroeconomic driver, we recommend monitoring the St. Louis Federal Reserve’s FRED data on the total number of employees in the Finance and Insurance sector. (FRED Source Code: CES5552000001)

This series provides a monthly, objective view of the labor market health within FactSet’s core client base. Our internal calculations reveal a long term positive correlation between this employment count and FactSet’s share price, characterized by a correlation coefficient of 0.87. This strong statistical relationship confirms that tracking industry-wide hiring trends serve as a reliable, high conviction monitoring tool for assessing the firm’s forward looking revenue potential.
D2. Mergers & Acquisitions Worldwide
Mergers and Acquisitions (M&A) activity serves as a critical macroeconomic engine for FactSet, acting as a force multiplier for the firm’s deal maker client segment. While FactSet’s subscription-based model provides inherent stability, the pace of M&A activity dictates the intensity of platform usage and the potential for upsell within investment banking and advisory firms.
The relationship between M&A deal flow and FactSet is fundamentally rooted in the deal lifecycle, where bankers leverage FactSet’s comprehensive suits including Pitch Creator, proprietary private market data, and screening tools to manage complex transactions. During periods of high M&A volume, investment banking desks operate with increased intensity, which drives demand for additional workstation seats and, crucially, increases the adoption of premium analytical add-ons.
Our internal research indicates a meaningful positive correlation between worldwide M&A transaction volumes and FactSet’s growth metrics, with a calculated correlation coefficient of 0.54. This in our view is a significant finding, particularly when considering that M&A focused clients represent only one segment of FactSet’s broader, diversified user base.

A notable divergence has emerged between recent M&A deal flow and FactSet’s share price performance. If our premise holds, that FactSet’s proprietary data infrastructure remains essential even amid intensifying market concerns over AI commoditizing financial information, the historical positive correlation between the two variables is likely to persist.
This suggests potential market inefficiency: if the share price has decoupled from the fundamental macro-level demand for high quality deal data, it may indicate that the stock is currently mispriced relative to its structural growth drivers. Consequently, this data gap presents a compelling case for a potential turnaround in the share price as the market reconciles FactSet’s role as the fundamental solutions provider.
D3. The Interest Rate Environment
Interest rates function as a primary lever for global capital markets, heavily influencing the deal making capacity of FactSet’s sell side clients, such as investment banks. In a high rate environment, the cost of capital rises, which typically dampens deals such as leveraged buyouts and complex M&A activity as financing becomes prohibitively expensive and valuation models face increased pressure. Conversely, declining interest rates often serve as a catalyst for deal velocity, as cheaper debt facilitates more aggressive acquisitions strategies and M&A pipelines rebound. For FactSet, a lower rate environment acts as a tailwind for the “Dealmaker” segment, driving demand for the analytics and screening tools necessary to execute transactions, whereas sustained high rates can create a headwind that forces investment banks to tighten budgets and trim head count.
D4. Market Volatility and Trading Volume
Market volatility, often proxied by the CBOE Volatility Index (VIX), serves as a direct indicator of institutional activity intensity. While period of extreme, prolonged instability can occasionally freeze decision making, moderate to high volatility generally acts as a driver for FactSet users. When markets are in flux, institutional traders, risk managers, and asset managers increase their usage of FactSet’s real time analytics, portfolio monitoring, and scenario testing tools to navigate uncertainty and rebalance assets. Furthermore, spike in trading volume typically correlate with higher demand for data infrastructure, as financial institutions require faster, more reliable, and more comprehensive data to maintain their competitive edge.
E. Financial Analysis
E1. The Checklist
We utilize a structured checklist framework for all A-Series trades, assigning scores according to established criteria. The following checklist includes concise explanations regarding each item and its relevance.
· Return on Equity (ROE)
ROE is calculated by dividing net income by shareholder’s equity. It measures how efficiently management generates profit using shareholder’s capital. High and sustainable ROE indicates strong profitability and potential competitive advantages. It helps assess whether the company creates value for equity holders.
· ROE Coefficient of Variation
Coefficient of variation (CV) of ROE measures the stability of a company’s returns over time relative to their average level. It is calculated as the standard deviation of Roe divided by the mean over a given period. While the absolute ROE level tells you how profitable a company is, the coefficient of variation tells you how consistent those returns are through time. A lower CV indicates that returns are stable and predictable, which is often characteristic of high quality businesses with durable competitive advantages. Conversely, a higher CV suggests that returns are volatile, which is common in cyclical, commodity-exposed, or highly leveraged businesses.
· Return on Equity vs Cost of Equity
Difference between ROE and Cost of Equity (Ke) measures whether a company is generating returns for shareholders that exceed the minimum required by investors to compensate for the risk of holding the stock. Comparing ROE to Ke provides a direct assessment of value creation: if ROE exceeds the cost of equity, the company is generating economic profit and creating shareholder value. If ROE falls below Ke, the company is effectively destroying value because it is earning less than investors require for the risk taken.
· Return on Invested Capital (ROIC)
While the ROE metric offers equity investors valuable insights into a company's profitability, the ROIC provides a broader perspective on management performance by evaluating how the firm utilizes both equity and debt capital to generate returns. ROIC is determined by dividing after-tax operating profit by investor capital (equity plus debt, excluding excess cash), thereby measuring returns generated for all capital providers. Like ROE, a consistently high ROIC reflects robust profitability and potential competitive advantages, enabling investors to assess whether the company is creating long-term value.
· ROIC Coefficient of Variation
The CV of ROIC measures the volatility of a company’s returns relative to its average ROIC over a period of time. It is calculated by dividing the standard deviation of ROIC by its mean, providing a normalized measure of how stable a company’s capital returns are. While the average ROIC indicates how efficiently a company generates profits from all invested capital, the CV shows how consistent those returns are from year to year. A low CV indicates stable, predictable returns, which often reflects a durable competitive advantage, strong pricing power, and effective capital allocation. Conversely, a high CV signals volatile returns, which is common in cyclical or capital-intensive industries and can make future cash flows less predictable.
· Return on Invested Capital vs Weighted Average Cost of Capital (WACC)
Return on Invested Capital (ROIC) versus Weighted Average Cost of Capital (WACC) measures a company’s ability to generate value from the capital it employs. ROIC represents the after-tax operating profit generated from all invested capital including equity and debt, while WACC reflects the blended cost of financing that capital or the minimum return investors require for the risk they take. Comparing ROIC to WACC indicates whether a company is creating or destroying economic value. When ROIC exceeds WACC, the company earns more than its cost of capital, signaling value creation. When ROIC falls below WACC, the company earns less than investors require, effectively destroying shareholder wealth
· Altman Z score
The Altman Z-score is a financial metric developed by Edward Altman in 1968 to predict the likelihood of corporate bankruptcy. It combines multiple financial ratios such as working capital to total assets, retained earnings to total assets, earnings before interest and taxes to total assets, market value of equity to total liabilities and sales to total assets into a single score. This score categorizes companies in to safe, gray, or distressed zones, providing early warnings of potential financial failure. Over decades of research and application, the Altman Z score has proven highly predictive, with studies showing that it can accurately forecast bankruptcy risk one to two years in advance for publicly traded manufacturing firms and has been adapted to private companies and non-manufacturing sectors as well.
· Beneish M -score
The M-Score is a financial model developed by Messod Daniel Benesih, a professor at Indiana University, to detect the likelihood that a company has manipulated its earnings. It uses eight financial ratios derived from company’s financial statements such as day’s sales in receivables, gross margin, asset quality, sales growth, depreciation, and leverage to produce a single score. If the M-score is above a certain threshold (commonly -2.22), it suggests a higher probability that the company may be engaging in earnings manipulation; if its below the threshold, manipulation is considered less likely. The model became widely known after it successfully flagged companies like Enron before their accounting scandals became public.
· Trends in Free Cash Flow
Unlike net income, which can be influenced by accounting maneuvers or non-cash charges, free cash flow measures the actual liquidity generated by the company’s core business model. By analyzing the cash flow trends over time, an investor can determine if a company is becoming more efficient at converting sales into cash or if its struggling with ballooning operational costs or capital requirements. A consistent, upward trend in free cash flow is a strong indicator of financial self-sufficiency, suggesting that a company can fund its own growth, pay dividends, or reduce debt without needing to tap the capital markets.
· Trends in Net Debt Issuance
Net debt issuance trends provide critical insight into a management team’s capital allocation strategy and their view on the company’s long-term leverage. Persistent, increasing net debt issuance can signal that a company is struggling to generate sufficient internal cash to support its current scale or is aggressively using leverage to mask operational weaknesses. Tracking whether debt is used for productive asset expansion or merely to fill cash flow gaps provide a map of the firm’s financial stability and risk appetite.
· Free Cash Flow vs Net Debt issuance
Comparing free cash flow directly against net debt issuance reveals the company’s ultimate financial sustainability. If a company’s free cash flow is high and increasing while its net debt issuance is stable or decreasing, it is operating from a position of strength. Conversely, if a company has a wide end growing gap where the cash required to fund operations and growth far outstrips the cash generated by the business forcing a reliance on constant debt issuance, it suggests that the business model itself may not be economically viable in the long run. Monitoring this dynamic is often the best way to catch the early warning signs of a liquidity crisis before it is reflected in the stock price.
· Valuation
At Baoro Research, we operate on the fundamental premise that a company’s intrinsic value is the present value of its future cash flows. To capture a holistic view of the company’s worth, we evaluate performance through three distinct, yet interconnected, lenses.
1. Free Cash Flow to Equity (FCFE): The residual cash available to shareholders after all expenses, reinvestment, and debt obligations are met.
2. Dividends: A measure of the tangible cash returned to owners, reflecting the company’s maturity and commitment to capital return.
3. Total Shareholder Yield: The aggregation of dividends and net share repurchases, providing a comprehensive view of how management chooses to deploy excess capital.
Our investment criteria are two-fold. First, the stock must trades at a meaningful discount to the intrinsic value from our valuation models. Second, and equally important, we seek alpha generation: a situation where the expected rate of return offers a significant premium over the company’s cost of equity.
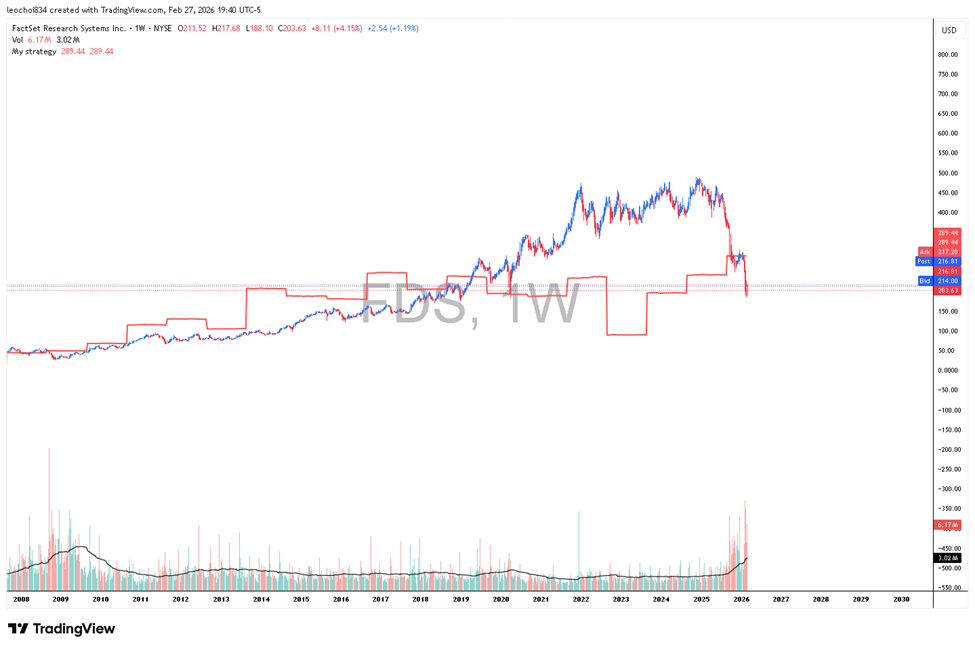
· Technical Entry Point
While we firmly believe that fundamentals are the primary engine of long-term value creation, we recognize that short-term price movements are often subject to technical volatility and market sentiment. A Baoro Research, we bridge this gap by synthesizing fundamental analysis with a technical framework.
We employ a proprietary model designed to identify the formation of local market troughs, key technical indicators that signal a potential reversal in price momentum. By discerning these technical entry points, it allows us to initiate positions at a more attractive time while proactively minimizing potential drawdowns.
E2. Checklist Application
ROE, ROE CV & ROE vs Ke
The company consistently demonstrates strong financial efficiency, maintaining long-term return on equity of 44%, which significantly exceeds the 15% benchmark. Furthermoe, the long-term coefficient variation for its ROE is 0.25, comfortably below our 0.3 risk threshold, indicating high stability in its profitability.
Applying the Capital Asset Pricing Model (CAPM) with a long-term median regression beta of 0.80, we calculate the cost of equity at 10%. This figure remains substantially lower than the company’s long-term average ROE. The spread between company’s ROE and its cost of equity serves as a clear signal that it is generating significant excess value. By consistently outperforming its cost of capital, the firm demonstrates an effective strategy for creating and delivering sustainable economic value to shareholders over the long term.
ROIC, ROIC CV & ROIC vs WACC
The company maintains a long-term average return on invested capital of 24%, substantially outperforming our 15% benchmark. Derived from the company’s capital structure of 83% equity and 17% debt alongside with strong interest coverage ratio exceeding 13x, we estimate a weighted average cost of capital of approximately 8%. The consistent positive spread between the company’s ROIC and its WACC confirms that the firm is generating significant economic value, comfortably exceeding its hurdle rate. This performance is a clear indicator of a dominant, highly efficient operational model and a durable competitive advantage that allows the company to reinvest capital at high rates of return.
Altman Z-Score
The company maintains an Altman Z-score consistently above our benchmark of 2.99, signaling that the probability of near-term financial distress is well contained. This score places the firm firmly within the "safe" zone, reflecting a robust balance sheet and sufficient liquidity.
While this current positioning is strong, continuous monitoring of this metric is essential. The Z-score serves as a vital early-warning system, allowing investors to detect shifting financial conditions that could signal an elevated risk of permanent capital loss long before they manifest in broader market sentiment.

Beneish M-Score
The Beneish M-Score indicates a low probability of earnings manipulation, suggesting that the company’s financial reporting is transparent and reliable. This provides additional confidence that the provided financial statements accurately reflect the firm’s true operational performance.

Free Cash Flow vs Net Debt Issuance
FactSet’s free cash flow continues to show positive momentum and long-term growth. This trend is complemented by disciplined capital allocation; the company has maintained a gross debt leverage ratio of approximately 1.4x while actively deploying capital toward strategic share repurchases.
When combined with the firm’s strong ability to create economic value evidenced by a ROIC of 24% comfortably exceeding its WACC. The company showcases its ability to generate substantial excess returns while maintain prudent capital structure, which provides a strong back for its intrinsic value.
Provided the market’s current AI-related narrative does not fundamentally commoditize the firm’s data edge, the combination of growing free cash flow and a healthy spread between its capital costs suggest that FactSet is well positioned to continue compounding intrinsic value. Monitoring these cash flow metrics alongside the firm’s continued investment in AI-powered productivity tools will be key to determining if the market’s current valuation fully reflects this structural resilience.

Valuation
Dividend Discount Model

Our dividend discount model (DDM), which relies exclusively on projected dividend payouts, yields an intrinsic value estimate of $100 per share. While this figure sits below the current market price, it is important to contextualize this discrepancy: FactSet’s valuation is driven primarily by a growth oriented narrative rather than a yield based value thesis.
In this framework, the gap between the market price and our DDM-derived value can be interpreted as the “growth premium”, the present value of the firm’s anticipated future earnings expansion. Our analysis suggests that while investors are indeed paying a premium for this growth, the current “spread” is relatively narrow compared to historical levels.
Dividend + Share Buyback Valuation
For FactSet, dividends represent only one component of a broader capital return strategy. The company has consistently utilized share repurchases as a mechanism to deliver value to shareholders. When incorporating these buyback levels into our discounted cash flow projections, our intrinsic value estimate rises significantly to approximately $290 per share.
Given the company’s solid liquidity position, exiting the first quarter of fiscal 2026 with $275 million in cash and cash equivalents, and managements to expand the existing share repurchase authorization to $1 billion in December 2025, it is highly probable that FactSet will continue to execute aggressive buybacks. This proactive approach not only supports the share price by reducing the outstanding share count but also reinforces the market’s confidence in the firm’s long term intrinsic value.
Free Cash Flow Valuation

High levels of dividends and share repurchase are only sustainable when supported by free cash flow. By utilizing free cash flow as the primary driver in our discounted cash flow valuation model, we arrive at an aggressive intrinsic value estimate of approximately $390 per share, representing significant upside potential from the current market price.
Crucially, the recent intrinsic value expansion is driven by organic operational growth rather than debt financed maneuvers. Because the company is generating this cash through tis core business activities, we have a high degree of confidence that this intrinsic value is sustainable throughout our investment horizon. When we integrate this fact with our “excess return” analysis, specifically the consistent positive spread between ROIC and WACC the case for future upward revisions to our target price become increasingly compelling.
This mosaic of organic cash generation and superior capital efficiency serves as a powerful validation of the company’s long term earnings power, reinforcing our bullish outlook despite current market headwinds.
Putting It All Together
In our view, FactSet has been unfairly caught in the crossfire of broader market concerns regarding software companies and the rapid advancement of generative AI. Skeptics fear that AI may commoditize financial data, potentially undermining business models that companies like FactSet employ. However, we contend that this narrative is largely noise. The core concern for investors should not just be the speed at which a platform can scrape or facilitate data, but rather the reliability of the information being aggregated.
Current Ai based data feeders often rely on indiscriminate, broad-spectrum information, making data integrity and “hallucination”: prevention significant challenges. Conversely, FactSet’s competitive advantage anchored by high client retention, proprietary data depositories, and a deep understanding of professional user interfaces position it uniquely within the AI narrative.
FactSet has a proven history of profitability, transparent financial records, and a consistent ability to generate excess returns. Its institutional moat is fortified by high switching costs and regulatory barriers that protect incumbent firms. While the firm’s cost advantages, as reflected in its gross, operating, and net margins, warrant diligent monitoring, the overall structural integrity of the business remains strong.
This resilience is also supported by meaningful structural tailwinds, beyond the previously discussed AI narrative. Employment levels within the finance and insurance sectors remain sticky, indicating sustained demand for the essential workflow infrastructure FactSet provides. Furthermore, recent data regarding global M&A activity, specifically in deal counts and total transactional values confirms a structural tailwind for FactSet’s segments, as advisory firms continue to rely on the platform’s high intensity analytical tools.
The current divergence between M&A activity and FactSet’s share price suggests a market inefficiency rather than a fundamental flaw. As deal-making activity has trended upward since fiscal 2025, the disconnect between this robust macroeconomic backdrop and the company's equity performance has created a compelling opportunity. When viewed through the lens of our valuation models, this discrepancy highlights a significant gap between the current share price and the company’s underlying intrinsic value, suggesting that FactSet is currently mispriced relative to its long-term growth potential and its superior ability to synthesize high-quality data.


Comments